Oracle Analytics
Parameter Binding New Feature & Use Case
Photo by Tyler Nix on Unsplash Parameter binding in Oracle Analytics Cloud refers to the ability to bind prompt values to filter components (for example) in data visualisation workbooks. The November 2023 update…

Parameter binding in Oracle Analytics Cloud refers to the ability to bind prompt values to filter components (for example) in data visualisation workbooks. The November 2023 update includes an extension to the parameter functionality which allows you to be able to bind a parameter to a range filter in a workbook.
Data Visualisation parameters in Oracle Analytics Cloud allow you to vary aspects of a visualisation at runtime using prompt selections. Some key points:
- Parameters can be set on visualisations like charts, graphs, maps etc.
- You can vary measures, dimensions, filters, etc by binding prompt values. For example, a parameter could allow the X axis measure or category dimension of a bar chart to change based on a prompt.
- Instead of having static hard-coded values, parameters let selections made at runtime drive the visualisations.
- Data Visualisation Parameters make it possible to create more flexible, interactive visualisations within a single workbook.
Data Visualisation parameters enhance flexibility, interactivity, and reuse by linking runtime user selections to the visualisations in an Oracle Analytics Cloud workbook.
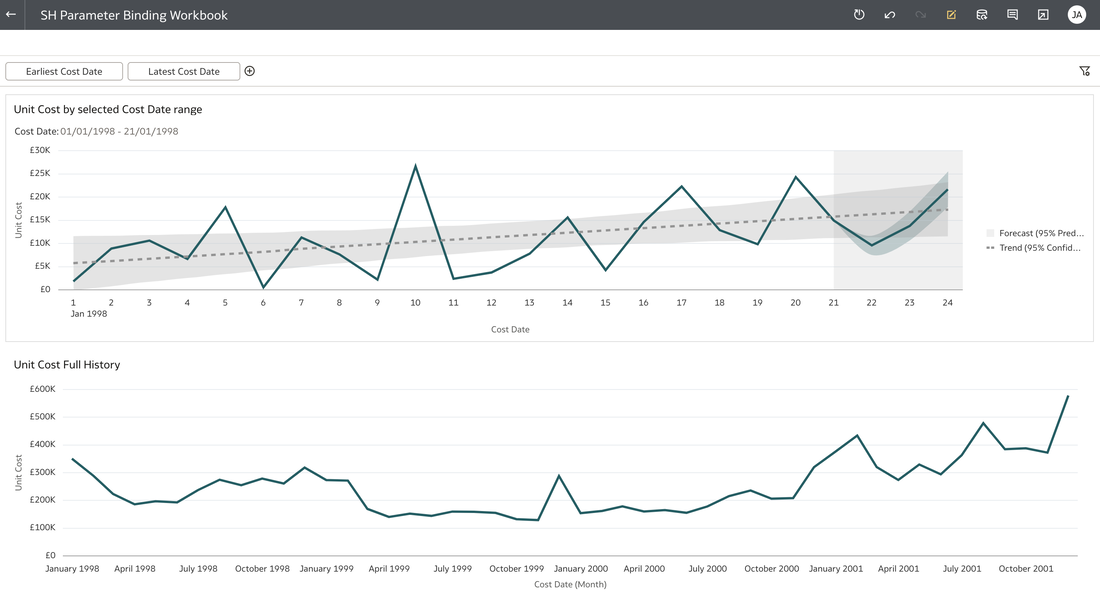
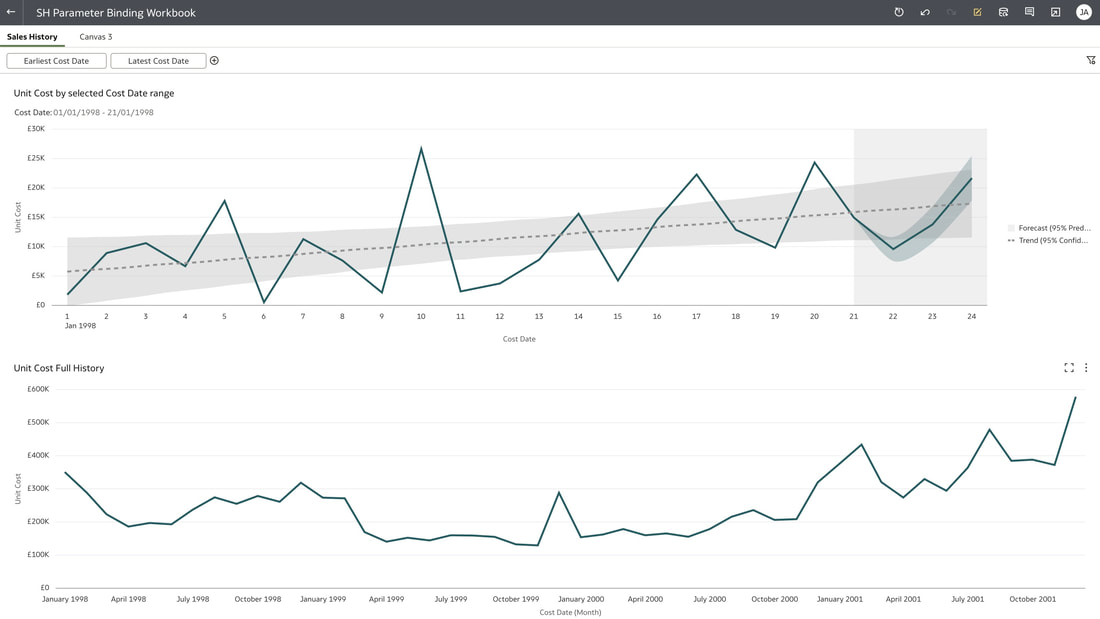
In the workbook above, a parameter has been bound to the Cost Date attribute. The filter on the visualisation at the top of this workbook was set up as a range filter on the Cost Date.
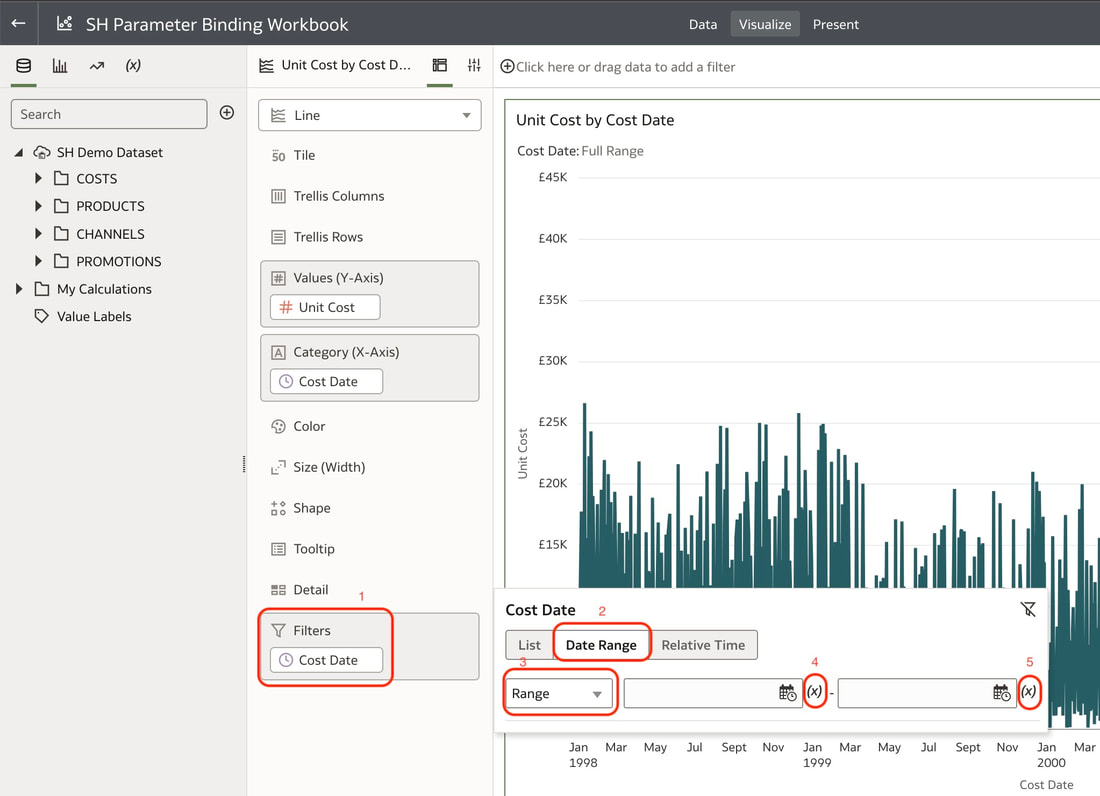
In the visualisation that you would like to apply a range filter, follow the steps below:
- Right click on the filter and select Modify Filter
- In this case, select Date Range
- Choose Range
- Clink on the Bind to Parameter icon for the low range option and select Create Parameter
- Repeat the same for the high range option
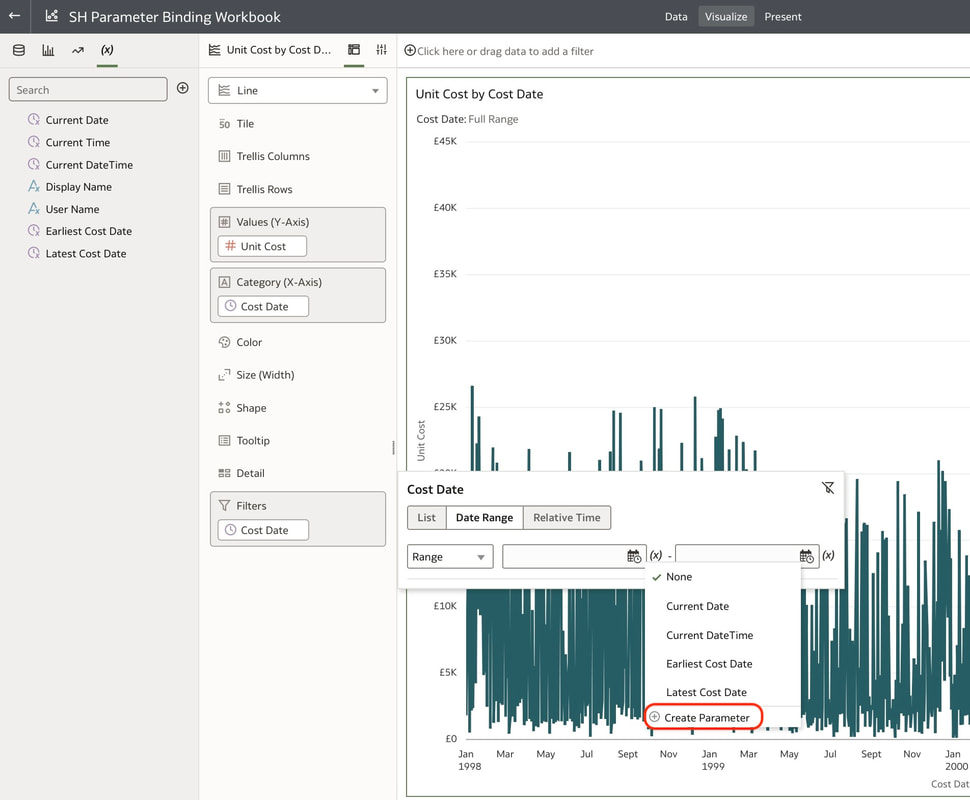
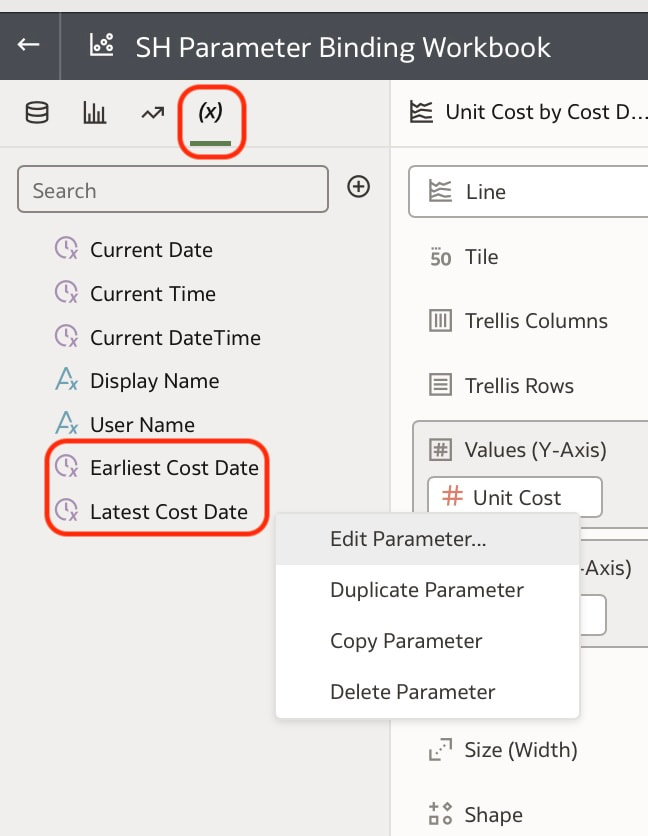
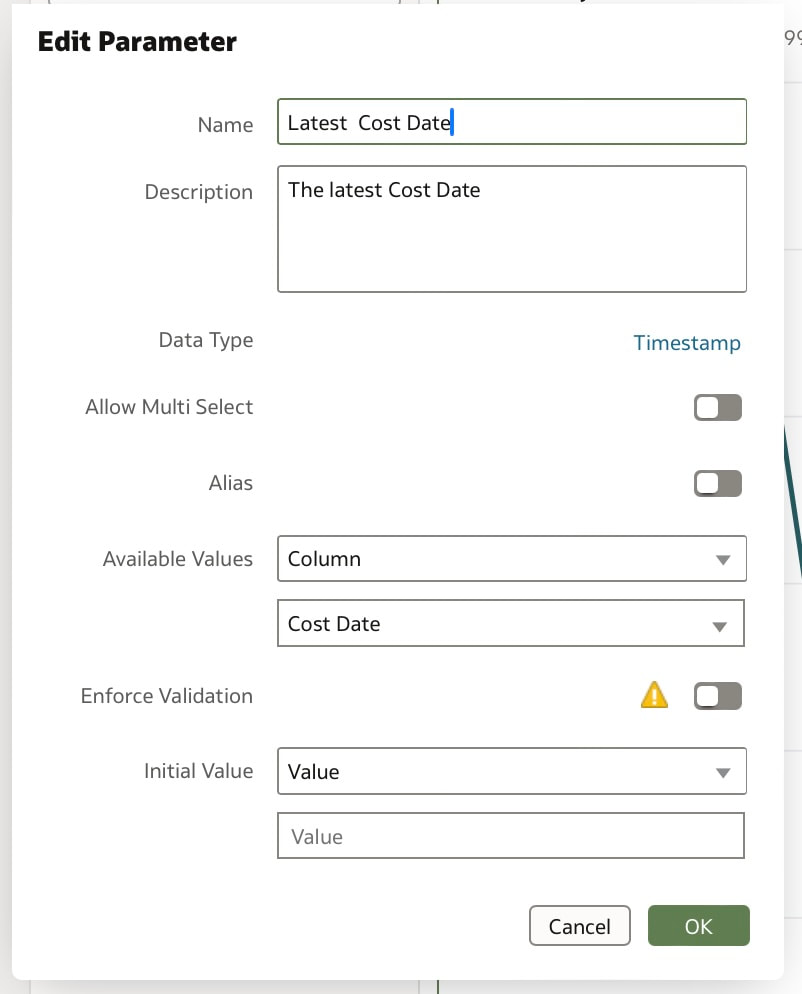
These steps create 2 parameters and binds the filter range to these parameters which you can see in the parameters tab in the Data panel. You can modify the automatically generated parameters if required by right clicking on the parameter.
|
|
Useful Use Case
You may have a situation where you want to show the full history on a canvas and also to show a subset of this in another visualisation. You can achieve this by creating the 2 visualisations. In the visualisation that should show the subset of data, you will need to create a range filter and bind to a parameter as we have done above.
The next step would be to drag the parameters from the data panel to the filters panel
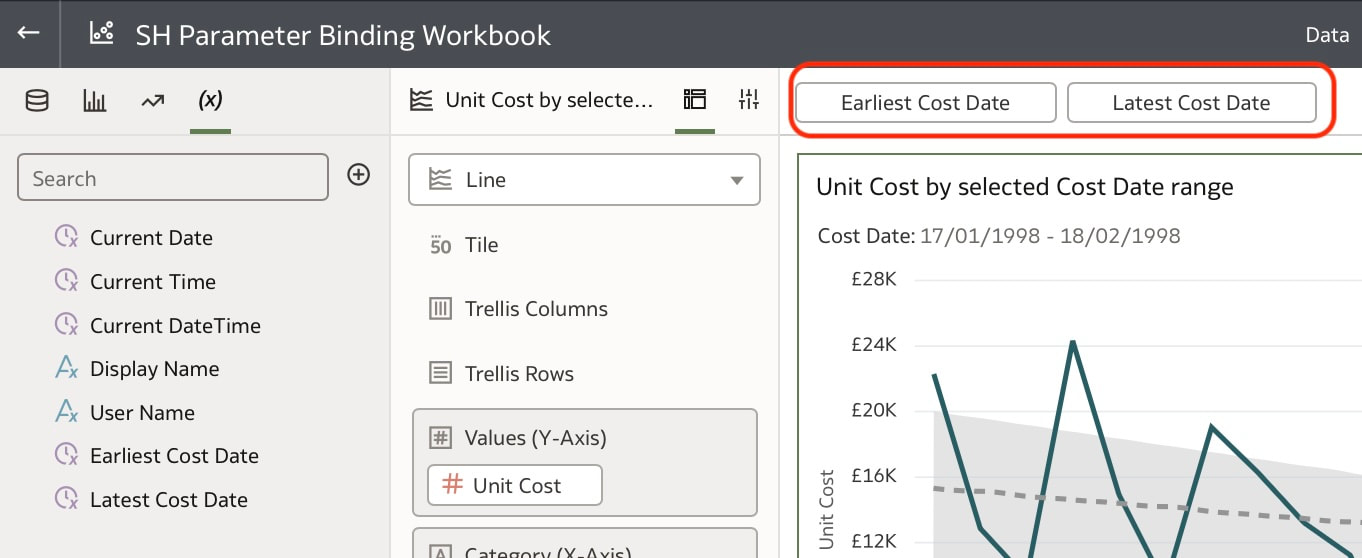
This will enable you to have the visualisation with a subset of data as well as another visualisation with the full history on the same canvas.
Conclusion
The new feature included in the November 2023 update that we have just looked which enables the use of parameters bound to range filters adds additional capabilities to the data visualisation parameters. Features like binding prompt values to various visualisation properties allow for adaptable, interactive visualisations that can change on the fly based on user input.
Whether selecting metrics or filtering data points, parameterisation facilitates reuse of workbooks. With visualisation parameters' ability to tap into prompt user selections and feed those dynamic values into the configuration of charts, graphs, maps and more, Oracle Analytics Cloud provides an excellent toolkit for customisable, exploratory data analysis.