OAC
Oracle Analytics Cloud 5.7.2 - some of the new features
Photo by Tomas Anton Escobar on Unsplash Version 5.7.2 of Oracle Analytics Cloud recently started rolling out to Cloud Customers. It comes with a couple of cool features which we'll go through in some detail. A full…

Photo by Tomas Anton Escobar on Unsplash
Version 5.7.2 of Oracle Analytics Cloud recently started rolling out to Cloud Customers. It comes with a couple of cool features which we'll go through in some detail. A full list of all the features can be found in the 'What's New' section of the Oracle Analytics Cloud documentation.
Performance Tile Enhancements
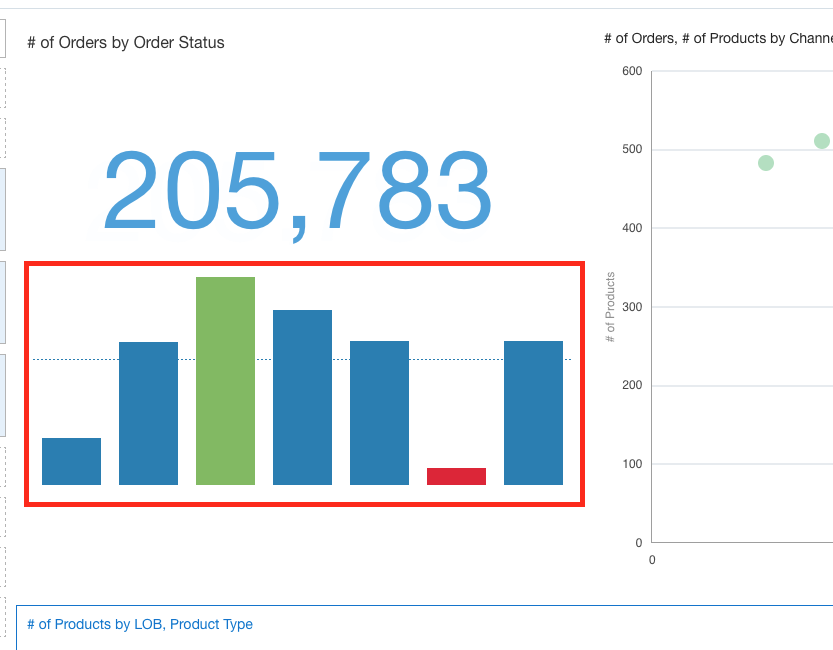
There is an update to the Performance Tile visualisation now that allows you to show a breakdown of the measure displayed by a dimensional attribute. There are options to show the dimensional attribute as a line chart, bar chart or as an area chart.
Database OML Models
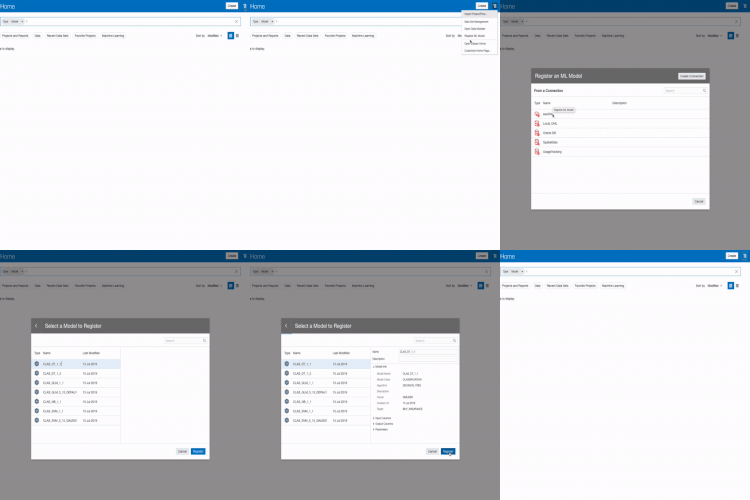
Oracle Analytics Cloud 5.7 now gives users access to register and apply Machine Learning models from an Oracle database (On-Premise or Autonomous Data Warehouse). The main benefit of this feature is that there is no longer any need to physically move data around whilst training and running the model.
The other benefit of this approach is that the computing power of the host database of the Machine Learning Model is used when it is executed in Oracle analytics Cloud.
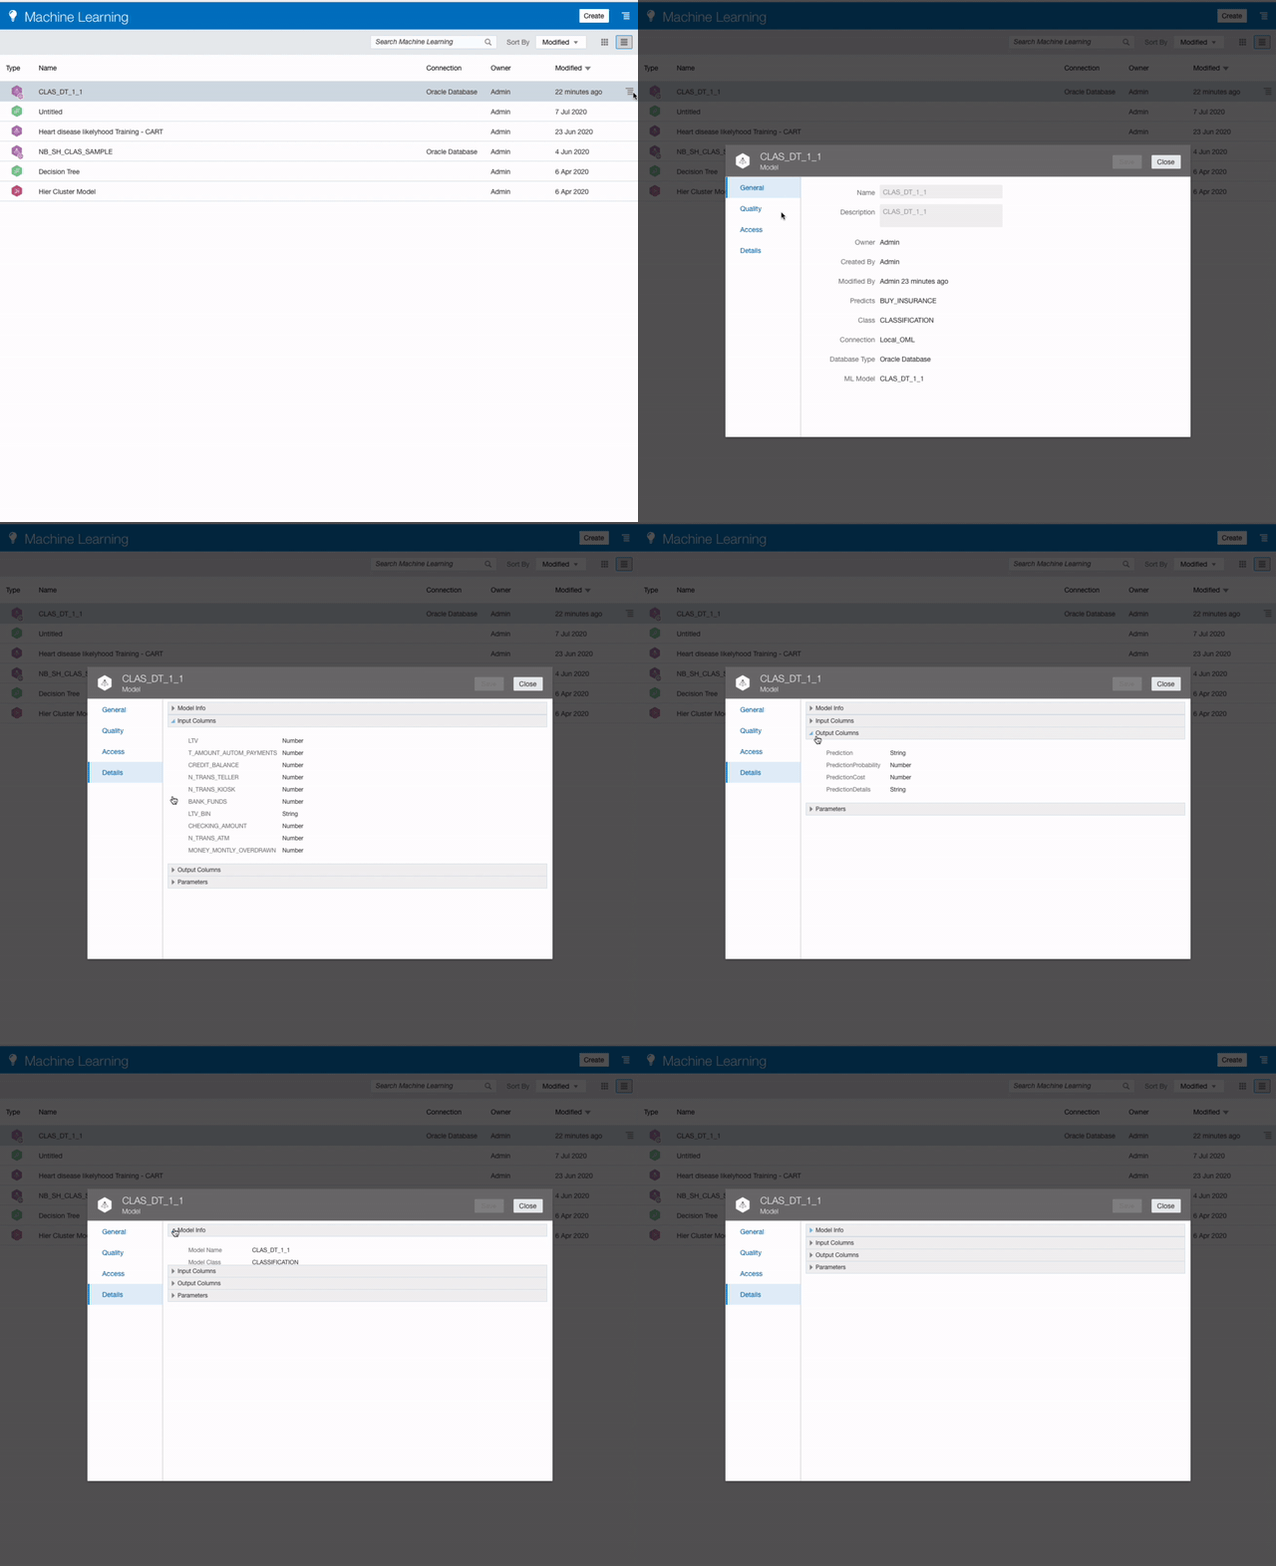
Once the model has been registered you can look at the properties of the model
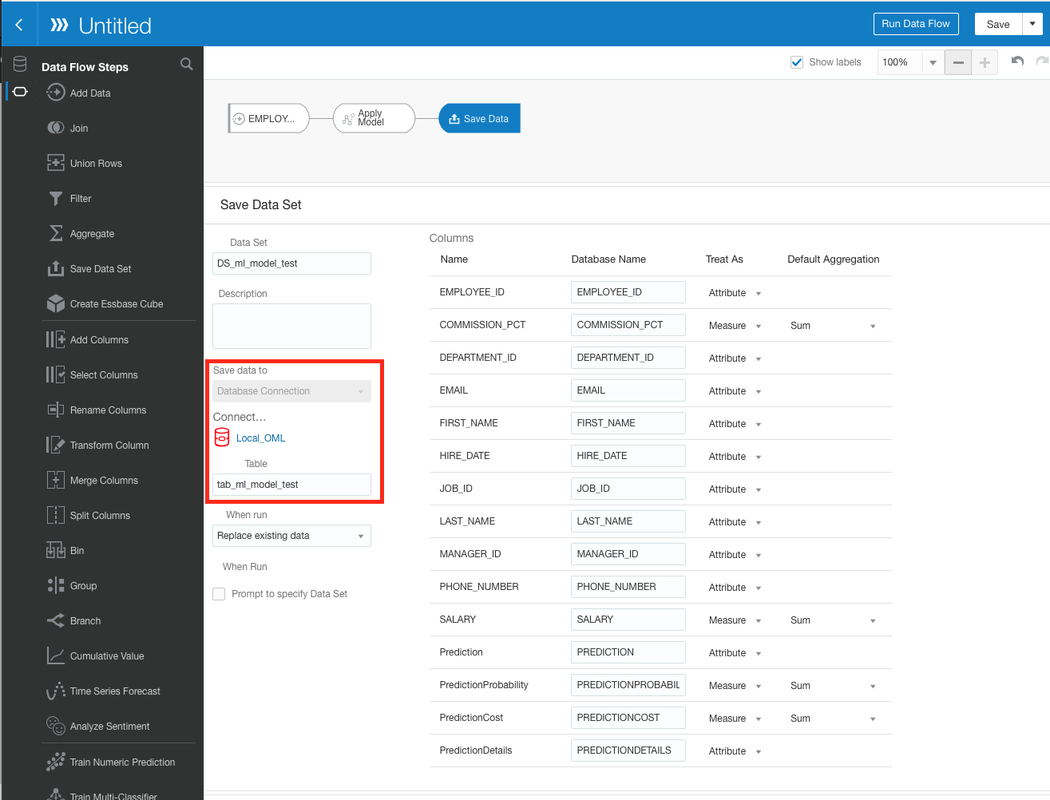
Now that the Machine Learning model has been registered, to make use of it in Oracle Analytics Cloud, you create a Data Flow bearing in mind that your data set must be located in the same database as your Machine Learning model (the connection must be the same for the data set and the model).
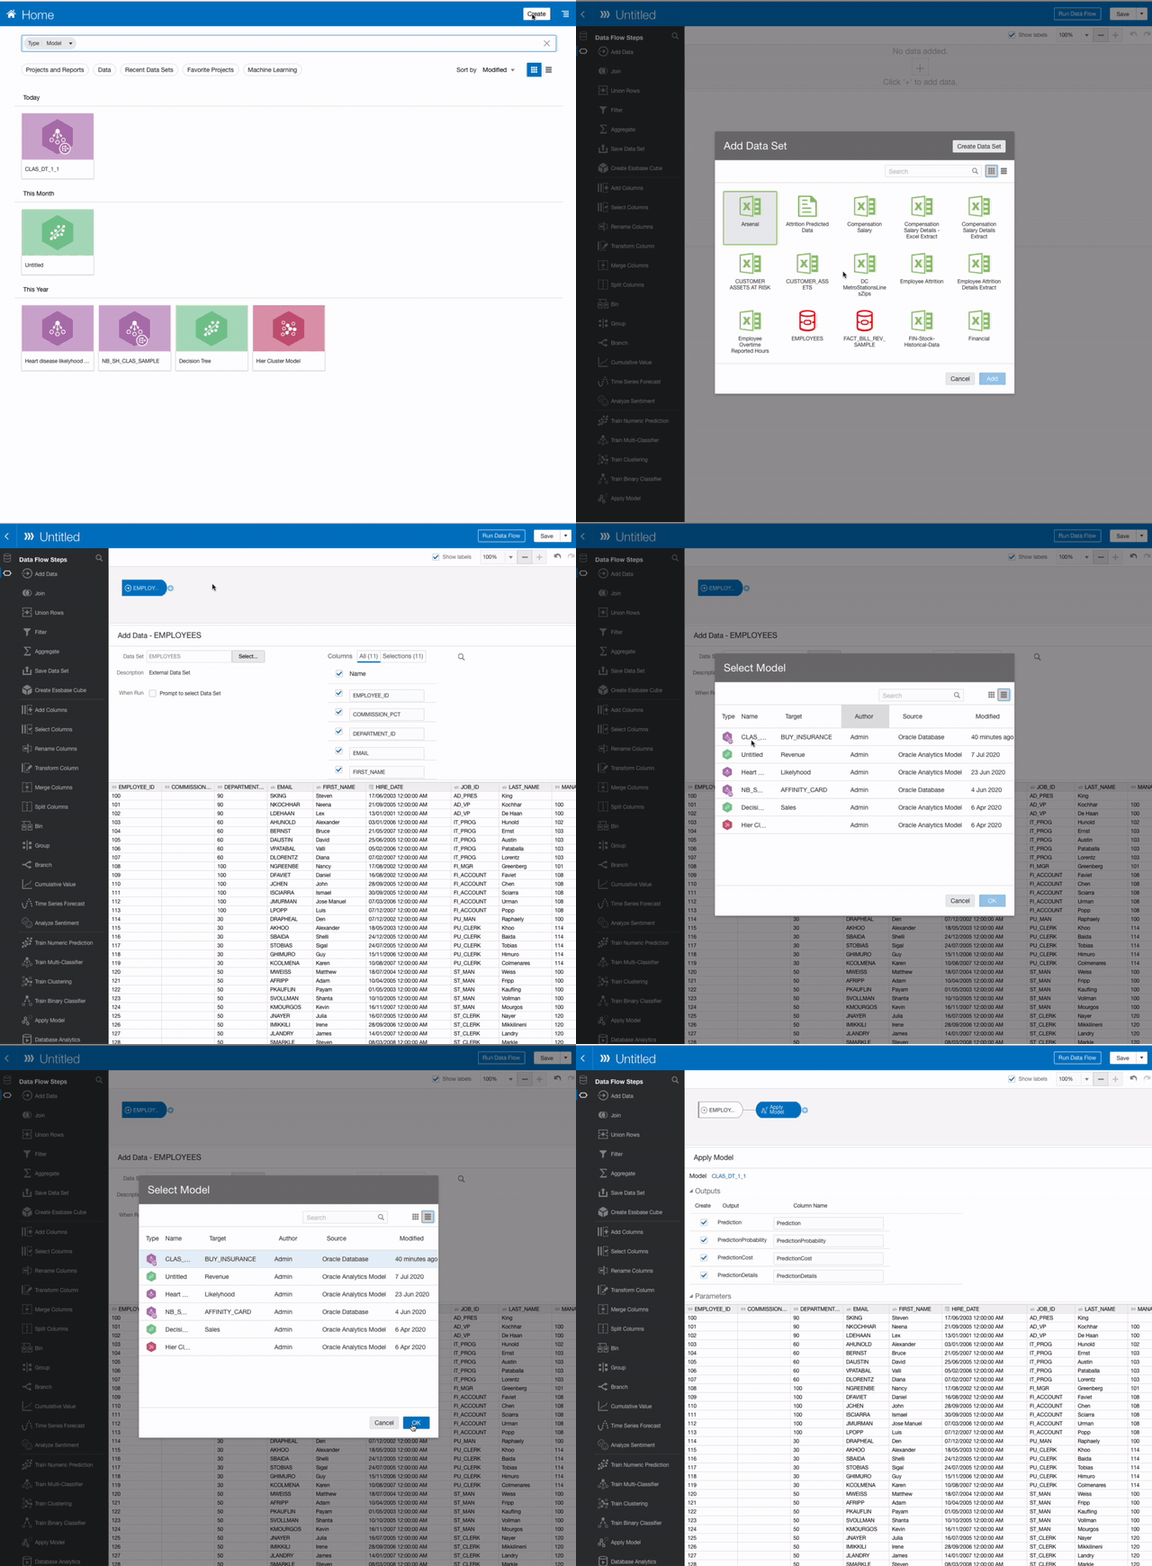
The final step in the Data Flow specifies where the saves the data which is returned from applying the model to the dataset with the predictions which have been calculated.
A table needs to be defined that stores this data in the same database as the Machine Learning model and the data.
List Box Visualisation
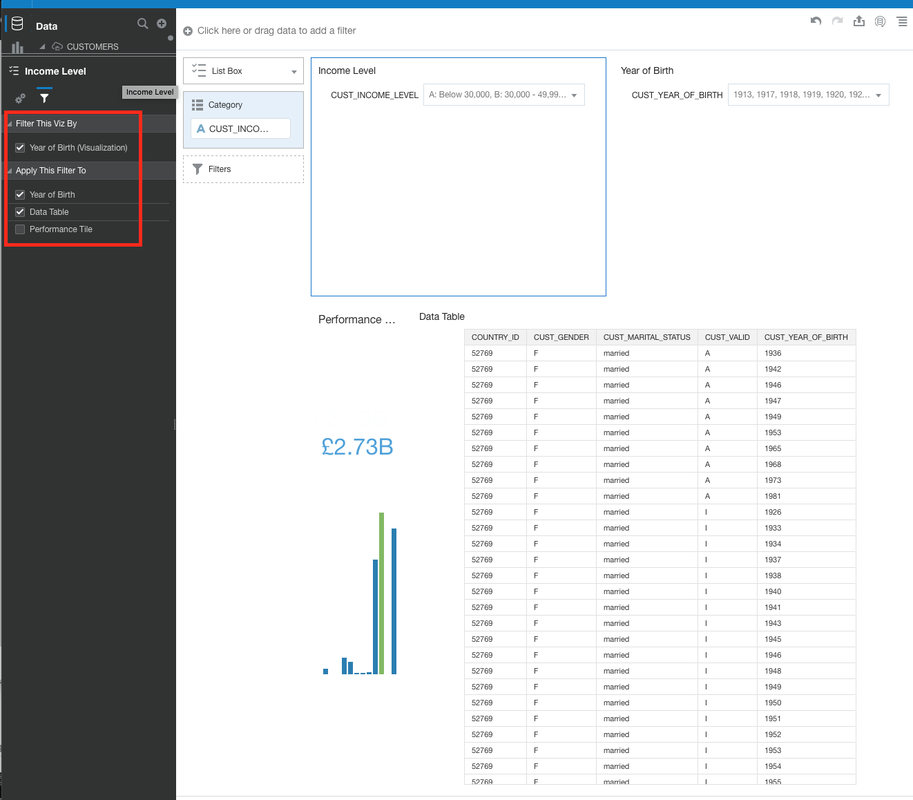
Now this is a feature akin to the OBIEE dashboard prompt although this new visualisation provides a bit more in terms of functionality. You now have the ability to filter visualisations on the canvas at a more granular level. The List Box visualisation filtering can be set to apply to visualisations that you specify. which gives you much more control over how end users can interact with the data on the canvases.
There is also the possibility to cascade filtering if you have multiple list box visualisations on a canvas in your project. This means that you can set up the filtering of one to filter on the other based on a selection.
There are some other features that are also included in this release which may be covered in a future blog post.